The panel
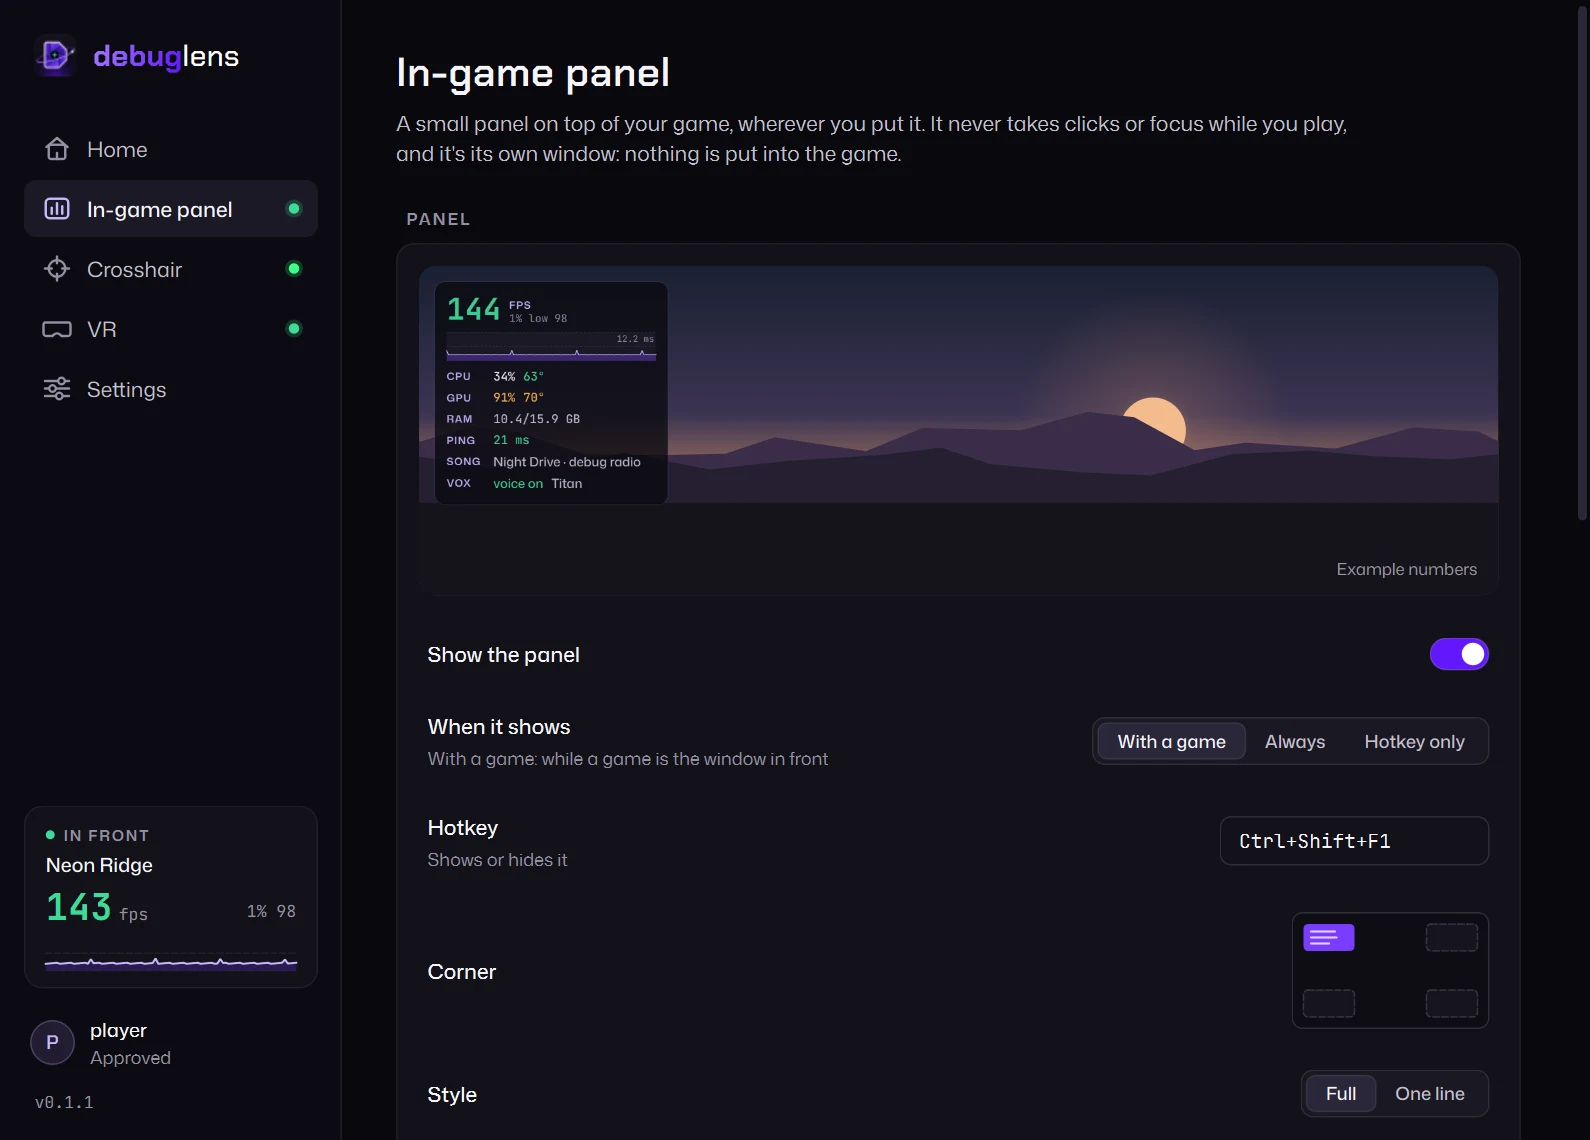
FPS with your 1% low, a frame time graph, CPU and GPU load and temperatures, RAM, graphics memory, ping and packet loss, download and upload, what's playing, your debugvox voice and the time. Show what you want, full or on one line.
It shows while a game is in front, always, or only with its hotkey (Ctrl+Shift+F1).
Put it anywhere
Press Ctrl+Shift+F3 in a game and drag the panel where you want it. Pull its corner or scroll on it to make it bigger or smaller, from 50% to 400%. It takes the mouse only while you move it.
Your crosshair
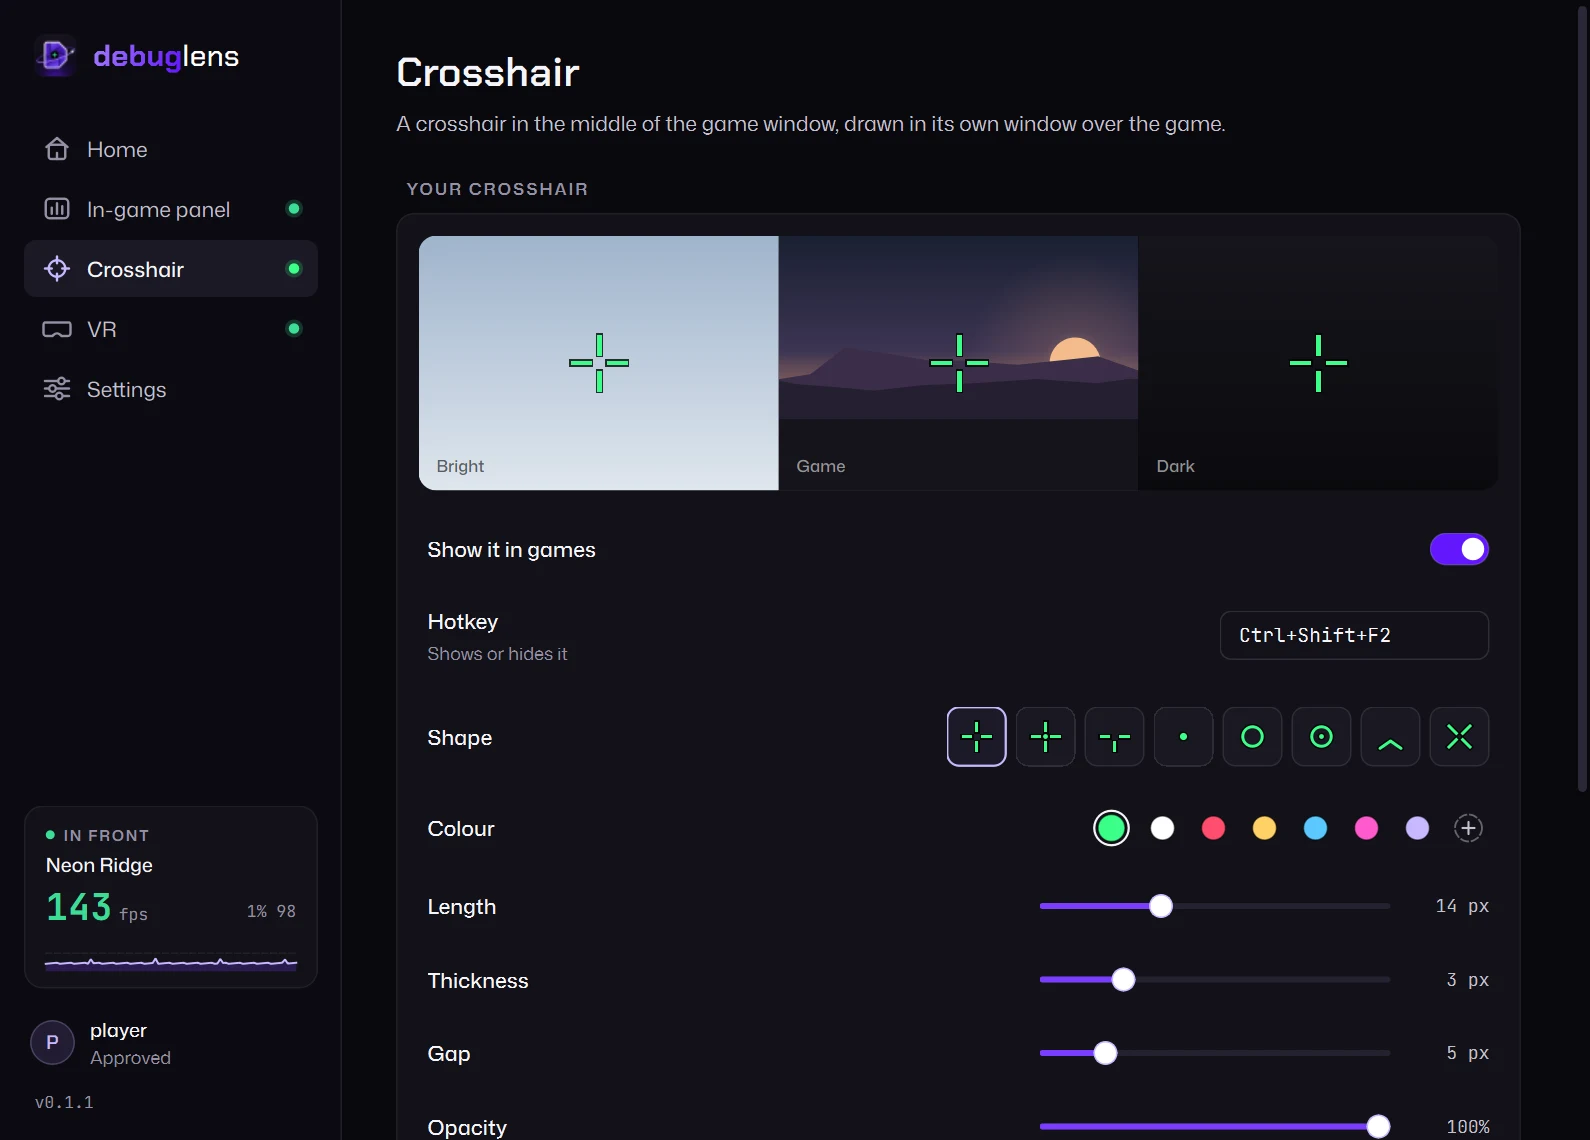
Eight shapes, any colour, and its length, thickness, gap, outline, dot and opacity, centred on the game window or moved a few pixels for games whose aim point isn't in the middle. Ctrl+Shift+F2 shows or hides it.
Some competitive games and tournaments don't allow crosshair overlays: check their rules first.
Where the numbers come from
FPS comes from Intel's PresentMon, which reads Windows' own graphics events for every game. Windows lets apps read them once you allow it: one prompt in debuglens, then sign out and back in.
CPU temperature needs HWiNFO (with Shared Memory Support on) or LibreHardwareMonitor running, since Windows can't read it on its own. Ping goes to your game's server when it answers, else to 1.1.1.1.
Out of your recordings
Turn on Hide from recordings and the panel and crosshair stay out of screenshots, recordings and streams while you still see them.
Exclusive full screen hides any overlay. Borderless and windowed show it, and most games default to borderless now.
Always in sight
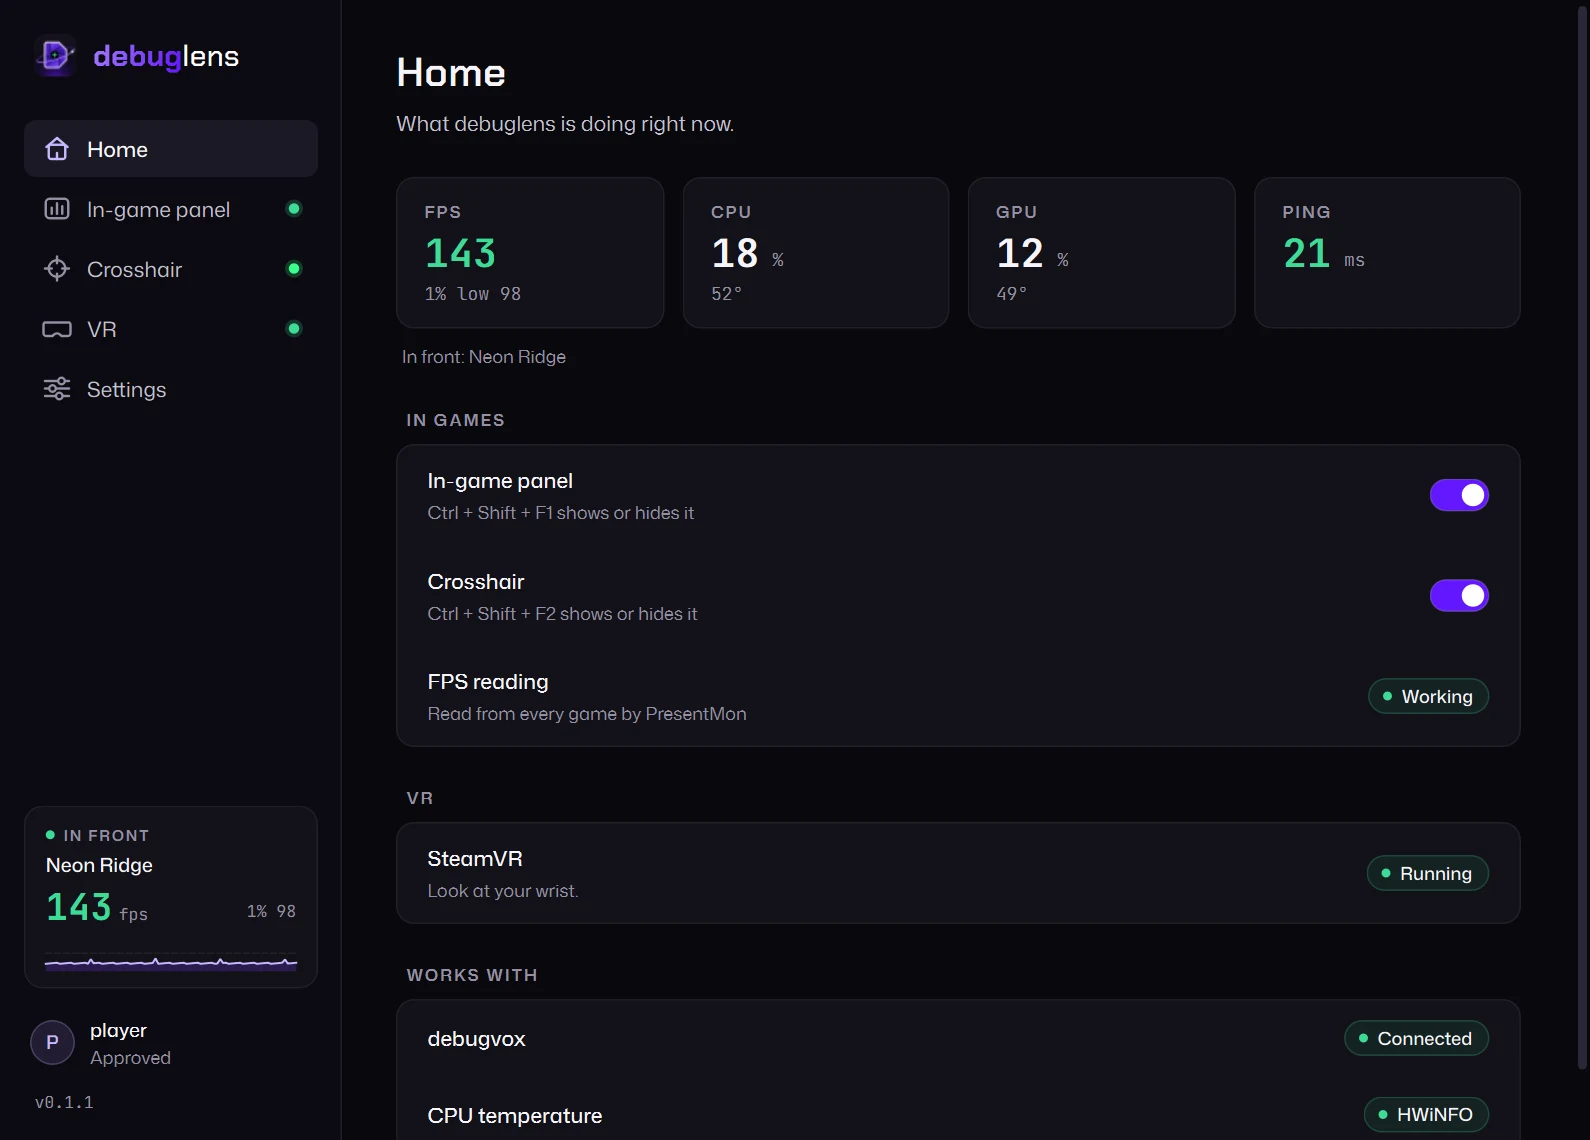
The app's sidebar shows the game in front with its FPS and frame times on every page, and a dot beside the panel, the crosshair and VR when they're on.